Water
Measured efficiency, water-free cooling, closed-loop reuse, or verified replenishment tied to the facility or its watershed.
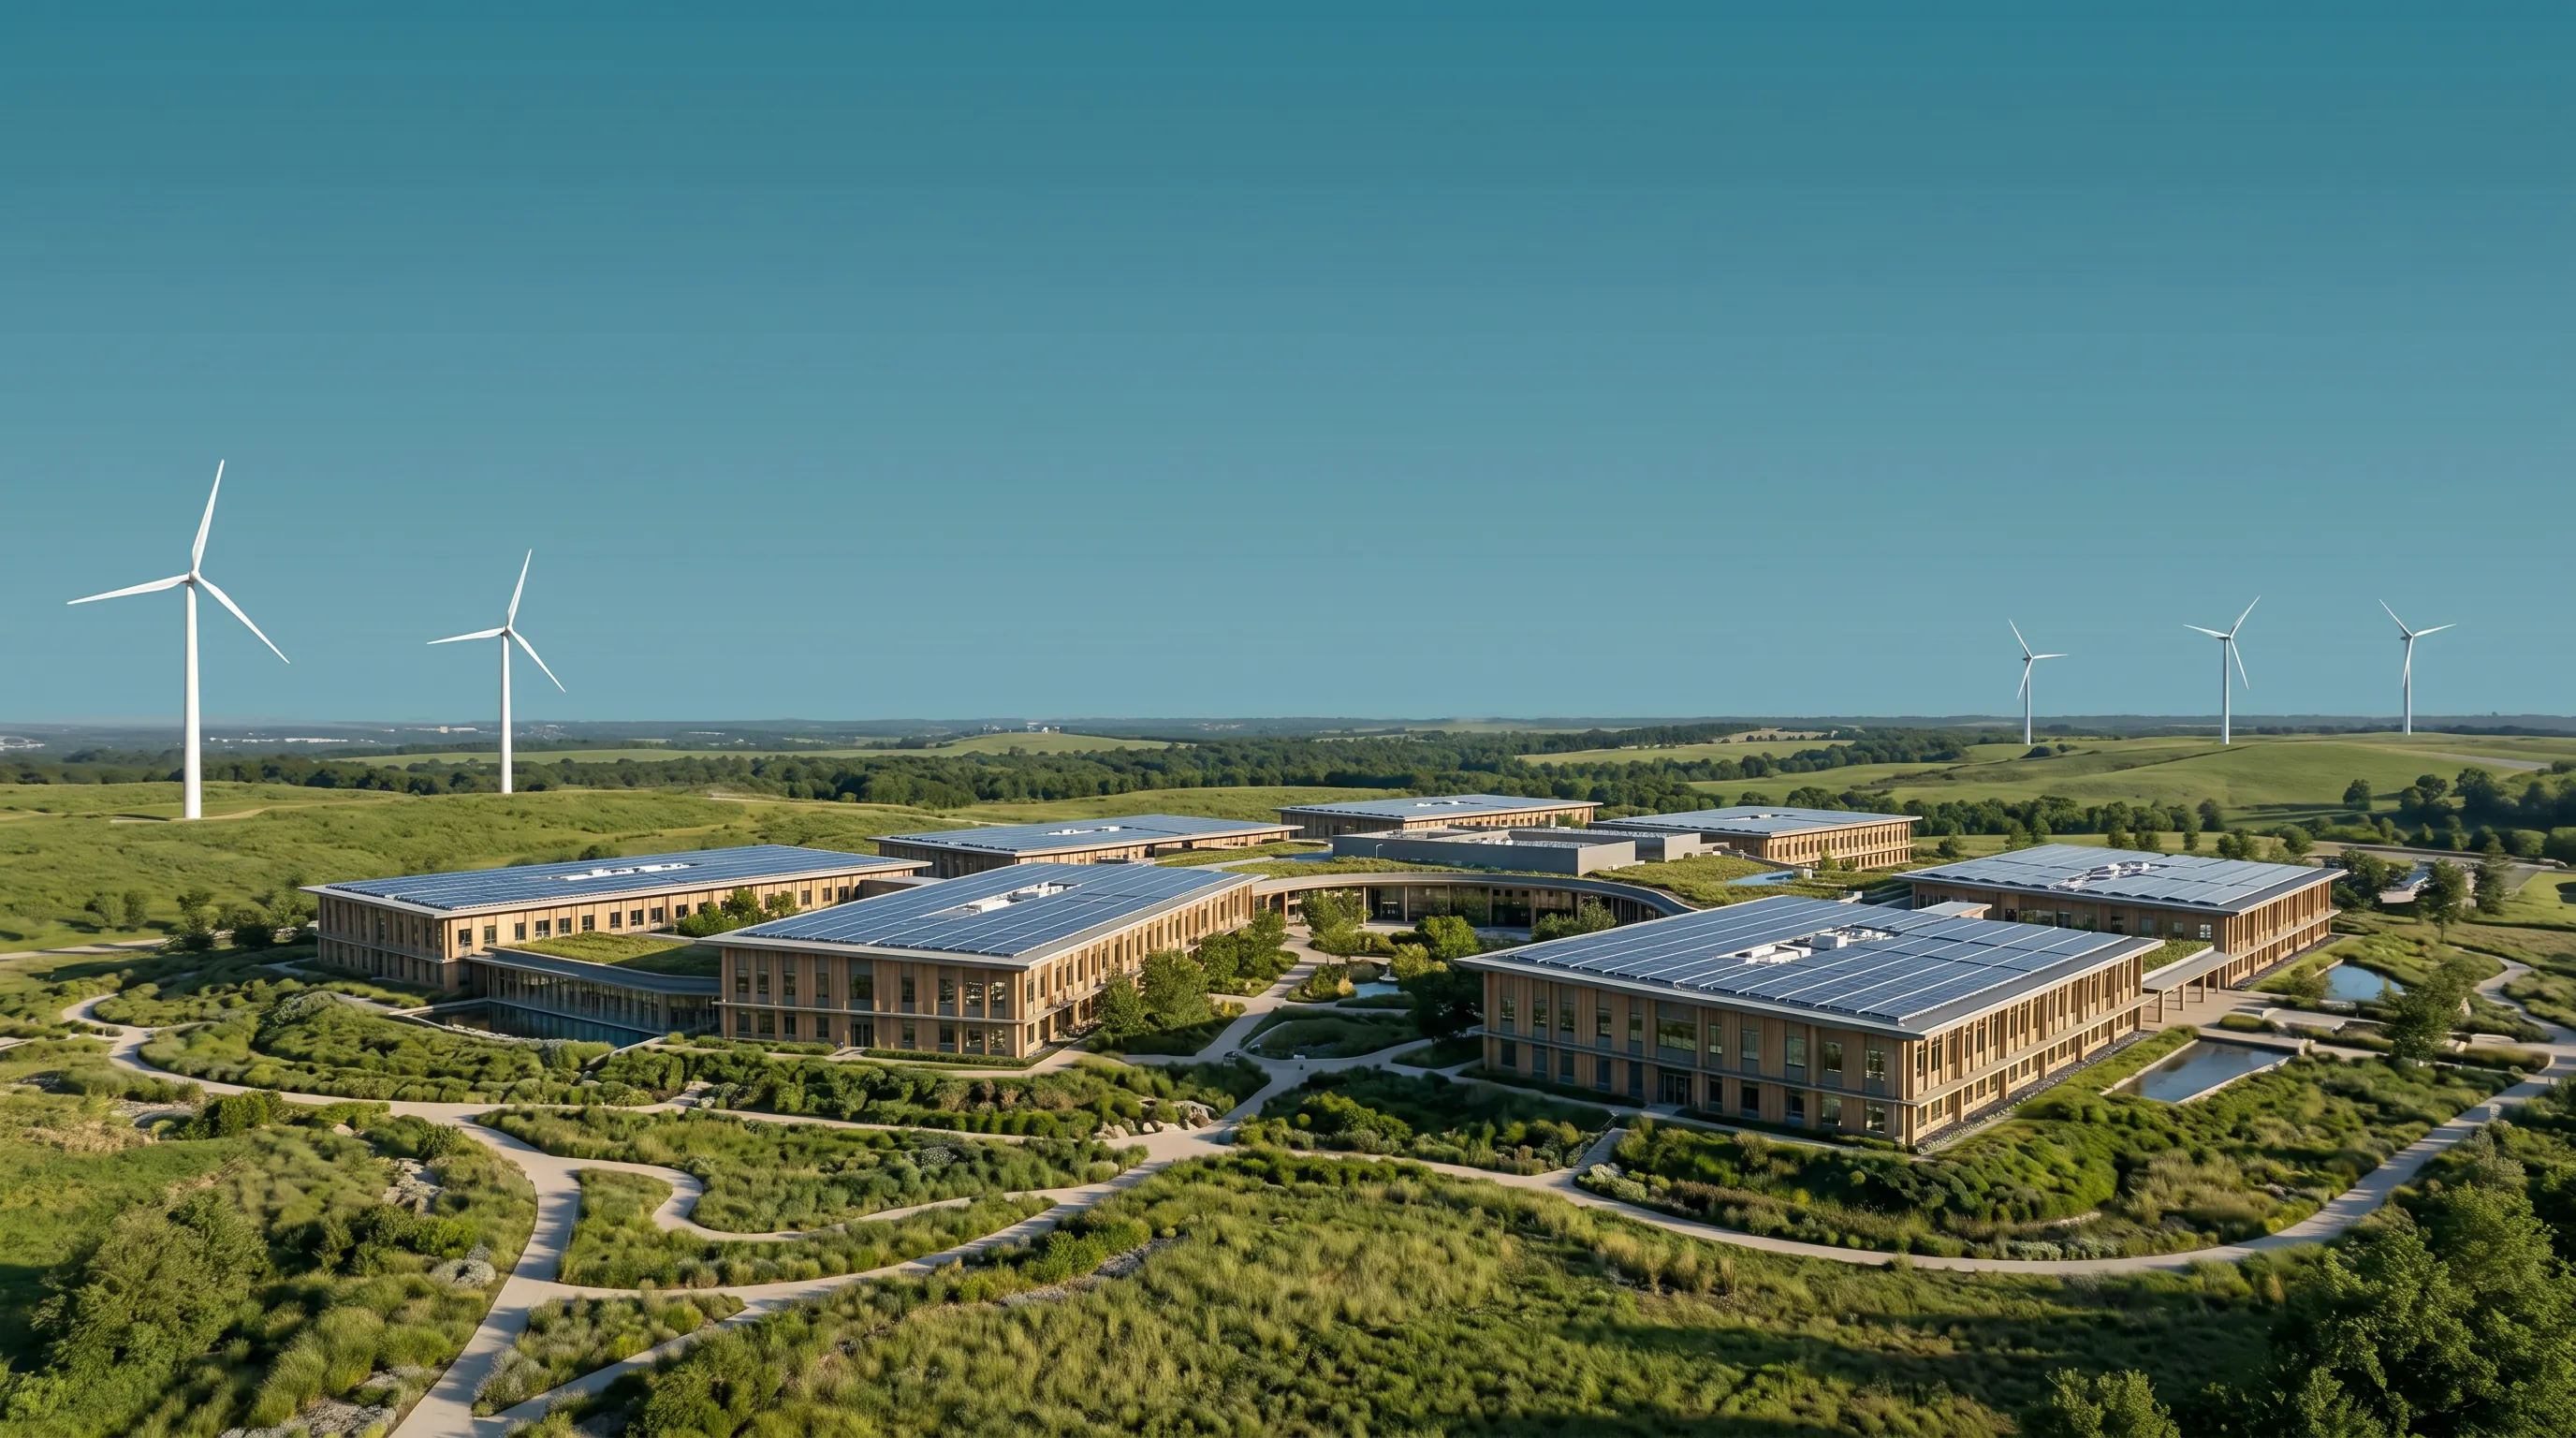
Eight operating U.S. data centers with unusually strong public evidence on water, energy, and local benefit.
The strongest sustainability claims are specific enough to measure—and limited enough to challenge.
This is a curated evidence set, not a definitive national ranking. A facility is included only when public sources document at least one site-level environmental result. Facilities with evidence across several categories appear first, while missing or portfolio-only data remains visible as a limitation.
Explore the national evidence mapCorporate goals provide context, but they do not earn facility-level credit. Each category uses a narrow evidence test so annual matching, offsets, permits, grants, and measured operating performance are not blurred together.
Measured efficiency, water-free cooling, closed-loop reuse, or verified replenishment tied to the facility or its watershed.
Facility PUE, renewable electricity coverage, or a local clean-energy procurement arrangement. Annual matching is not treated as hourly carbon-free operation.
A documented local partnership, community-identified investment, or public infrastructure benefit. Government approval alone is not treated as community support.
Operational noise reduction supported by public documentation. No facility in this edition published enough detail to receive noise-reduction credit.
Facilities with evidence across multiple categories appear first. A missing disclosure is shown as a gap—not treated as proof of poor performance.
| Facility | Water | Energy | Community | Noise |
|---|---|---|---|---|
| FacilityCyrusOne OCB1 · Council Bluffs, IA | WaterWater-free cooling | Energy100% renewable electricity through utility green tariff | CommunityNot sufficiently documented | NoiseNot disclosed |
| FacilityCyrusOne DFW1 · Carrollton, TX | Water65% annual reduction; net-positive water claim | EnergySolar supply and efficiency upgrades | CommunityRegional watershed projects | NoiseNot disclosed |
| FacilityMicrosoft · Des Moines, IA | WaterWUE 0.19 L/kWh; water cooling under 10% of year | EnergyPUE 1.16; 100% regional renewable coverage | Community$2.5M+ across 73 partners | NoiseNot disclosed |
| FacilityMicrosoft · Quincy, WA | WaterClosed-loop reuse; 138M gallons saved annually | EnergyPUE 1.156; 47% regional renewable coverage | CommunityJoint city water infrastructure | NoiseNot disclosed |
| FacilityCyrusOne PHX · Chandler, AZ | WaterWater-free cooling; net-positive water claim | Energy6.7 MW solar; ENERGY STAR at PHX3 and PHX4 | CommunityWatershed restoration | NoiseNot disclosed |
| FacilityMicrosoft · Cheyenne, WY | WaterWUE 0.23 L/kWh; water cooling under 5% of year | EnergyPUE 1.125; 47% regional renewable coverage | Community$879K across 28 partners | NoiseNot disclosed |
| FacilityMeta · Altoona, IA | WaterWater reuse, rain capture, native landscaping | Energy100% clean and renewable matching; added Iowa wind | CommunityGrants and local partnerships | NoiseNot disclosed |
| FacilityIron Mountain AZP-1 · Phoenix, AZ | WaterNo comparable site result found | Energy100% renewable power; design PUE as low as 1.2 | CommunityNot sufficiently documented | NoiseNot disclosed |
These profiles emphasize measured operating results and facility-specific arrangements. They are examples to learn from, not endorsements of every project decision made at each campus.
Case study 1
Council Bluffs, Iowa
OCB1 uses air-cooled systems and does not consume water for cooling. CyrusOne reports that the facility is powered by 100% renewable electricity through MidAmerican Energy’s GreenAdvantage tariff, which supports regional wind and solar projects.
Evidence limit: Public materials reviewed did not provide comparable community-outcome or operational-noise reporting.
Read the OCB1 energy caseCase study 2
Carrollton, Texas
CyrusOne converted the Carrollton facility to 100% water-free cooling, reporting a 65% reduction in annual water use. The operator also funds watershed restoration intended to return more water than the site consumes and added solar supply and efficiency upgrades.
Evidence limit: The net-positive designation includes off-site restoration and should not be read as zero on-site water use.
Read the Carrollton caseCase study 3
Des Moines, Iowa
Microsoft reported a 2022 PUE of 1.16 and WUE of 0.19 L/kWh for its Iowa data centers, with 100% renewable energy coverage from wind, solar, and hydro procurement. Outside-air cooling keeps cooling water use to less than 10% of the year.
Evidence limit: The cited metrics cover Microsoft’s Iowa data center region rather than a single named building.
Open the Iowa fact sheetCase study 4
Quincy, Washington
The Quincy Water Reuse Utility treats cooling water from Microsoft’s campus and returns it for reuse. The U.S. EPA estimates the closed-loop system saves 138 million gallons of potable groundwater annually.
Evidence limit: Renewable coverage in the cited period trailed the energy leaders in this collection.
Read the EPA case studyCase study 5
Chandler, Arizona
CyrusOne identifies Chandler as its first net-positive-water campus. The site uses water-free cooling, supports watershed restoration, and began receiving 6.7 MW of solar electricity.
Evidence limit: Public sources reviewed did not provide a current campus PUE or a measure of broad community approval.
Open the Chandler facility profileCase study 6
Cheyenne, Wyoming
Microsoft reported a 2022 PUE of 1.125 and WUE of 0.23 L/kWh for its Wyoming data centers. The cool climate allows outside-air operation with cooling water needed less than 5% of the year.
Evidence limit: The metrics apply to Microsoft’s Wyoming data center region and renewable coverage was partial in the cited period.
Open the Wyoming fact sheetCase study 7
Altoona, Iowa
Meta says Altoona’s electricity use is matched with 100% clean and renewable energy, supported by new Iowa wind capacity. The facility uses outside-air cooling, reuses water before discharge, captures rainwater, and uses native landscaping.
Evidence limit: The cited facility fact sheet does not publish a site-specific WUE or independently measured community sentiment.
Open the Altoona fact sheetCase study 8
Phoenix, Arizona
Iron Mountain reports 100% renewable power and design PUE as low as 1.2 for AZP-1. The facility also operates under ISO 50001 energy and ISO 14001 environmental management systems.
Evidence limit: Comparable facility-level water, community, and operational-noise results were not found in the public materials reviewed.
Open the AZP-1 data sheetEven the most transparent public examples remain incomplete. Comparable facility reporting would let communities evaluate operating performance instead of relying on broad portfolio narratives.
Publish electricity use, PUE, water withdrawal and consumption, WUE, source-water type, and the reporting boundary for each operating campus.
Report generator testing hours, boundary noise measurements, complaints, investigations, corrective actions, and post-commissioning verification.
Distinguish public approval from formal permits, philanthropic grants, negotiated infrastructure, and community-benefit obligations—and report whether each promise was delivered.
Separate on-site reductions from offsets or replenishment, annual renewable matching from hourly carbon-free operation, and design PUE from measured operating PUE.
Use these examples as a floor, not a finish line. A responsible data center should protect local water, strengthen the grid, limit neighborhood impacts, create durable community value, and publish enough operating evidence for those commitments to be checked. Read our sustainability standards.
Last updated July 2026. Review technical and policy information for the specific site, jurisdiction, utility territory, and operating plan.